Sales Dashboard
The Sales Dashboard provides a clear, real-time overview of your sales performance — all within Invent ERP. Whether tracking leads, quotations, orders, or revenue, this dashboard helps you spot trends, monitor KPIs, and make data-driven decisions that drive growth.
Why the Sales Dashboard Matters
A well-configured dashboard keeps your sales team focused and informed:
- Visibility into your sales funnel — see open leads, quotations, and confirmed orders
- Performance tracking — monitor sales by user, month, and product
- Quick access — view top customers and products right from the dashboard
- Informed decisions — drill down into details to adjust strategy or follow up where needed
Dashboard Overview & Layout
When you open the Sales Dashboard, you'll typically see panels like:
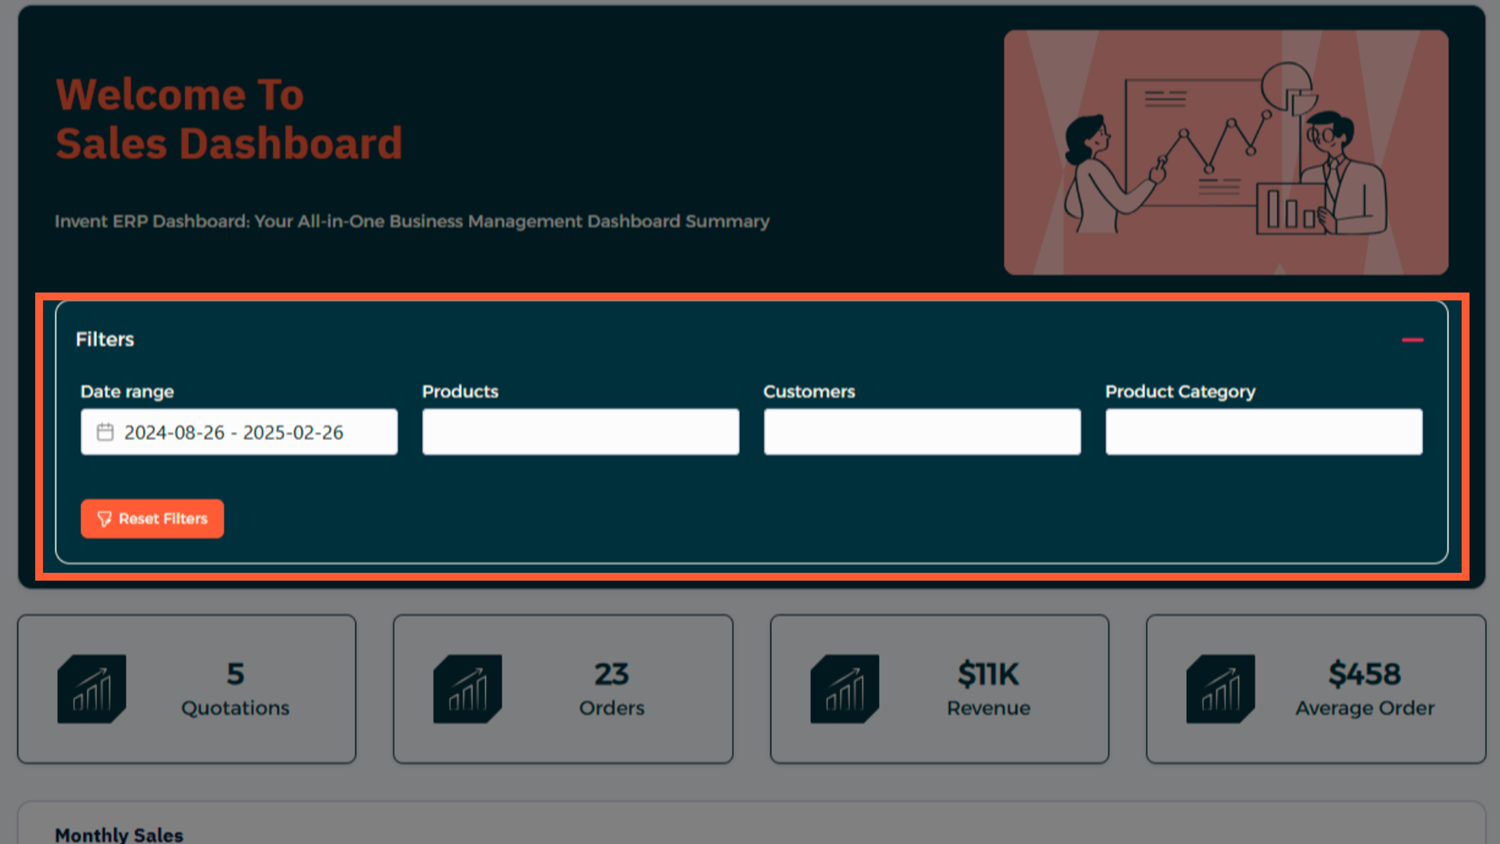
- Sales Overview/Filters (time frame, users, product categories)
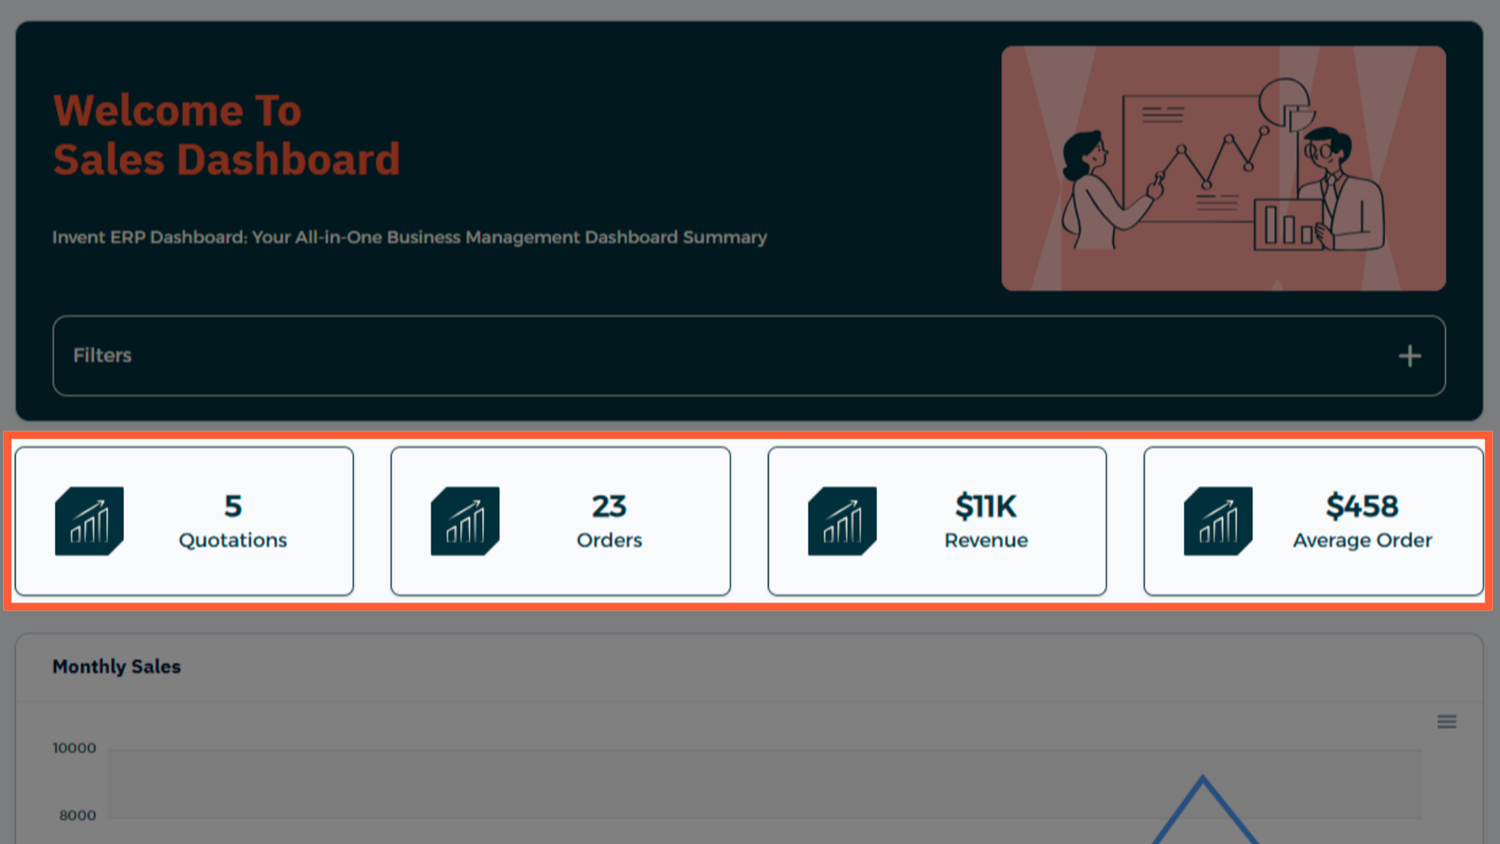
- KPIs (e.g., total revenue, number of orders, average order value)
- Chart Visualizations (bar or line charts showing sales over time)
- Top Categories (best-selling products or services)
Each panel is interactive — click on any part of a chart or table to access the underlying data.
Step-by-Step: How to Use the Sales Dashboard
-
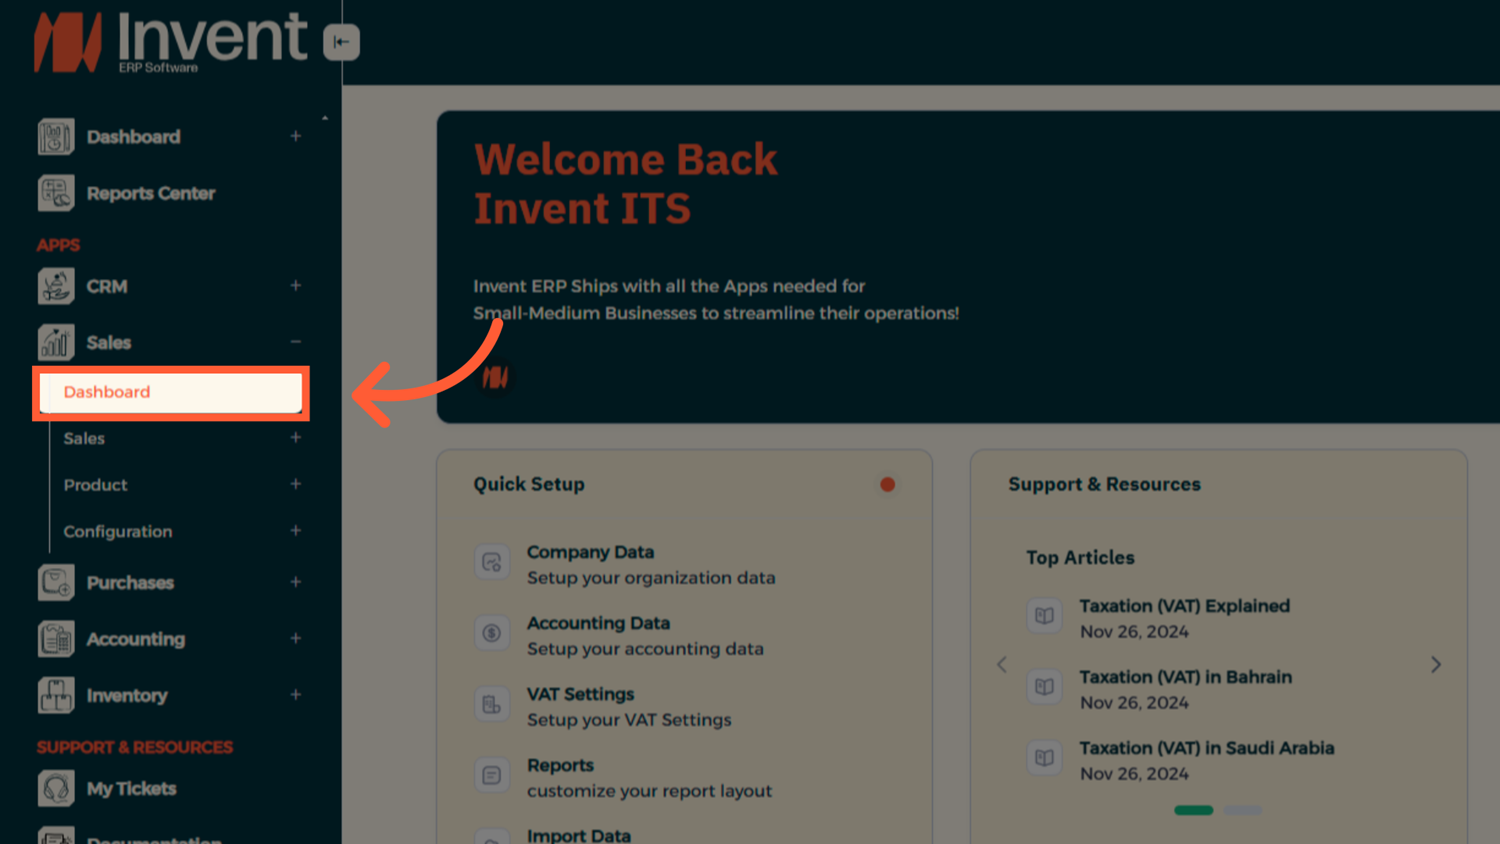
Navigate to the Sales Dashboard
Go to Sales → Dashboard in Invent ERP to view the dashboard.
- Adjust Filters to Focus
Use filters at the top — adjust date ranges, sales reps, or product categories — to tailor insights to your needs.
-
Read the KPIs
The dashboard highlights metrics like:
- Total sales revenue
- Number of quotations sent
- Number of sales orders confirmed
- Average transaction value
-
Explore Sales Over Time
View trends month-by-month. Compare performance across previous periods and identify seasonality or growth patterns.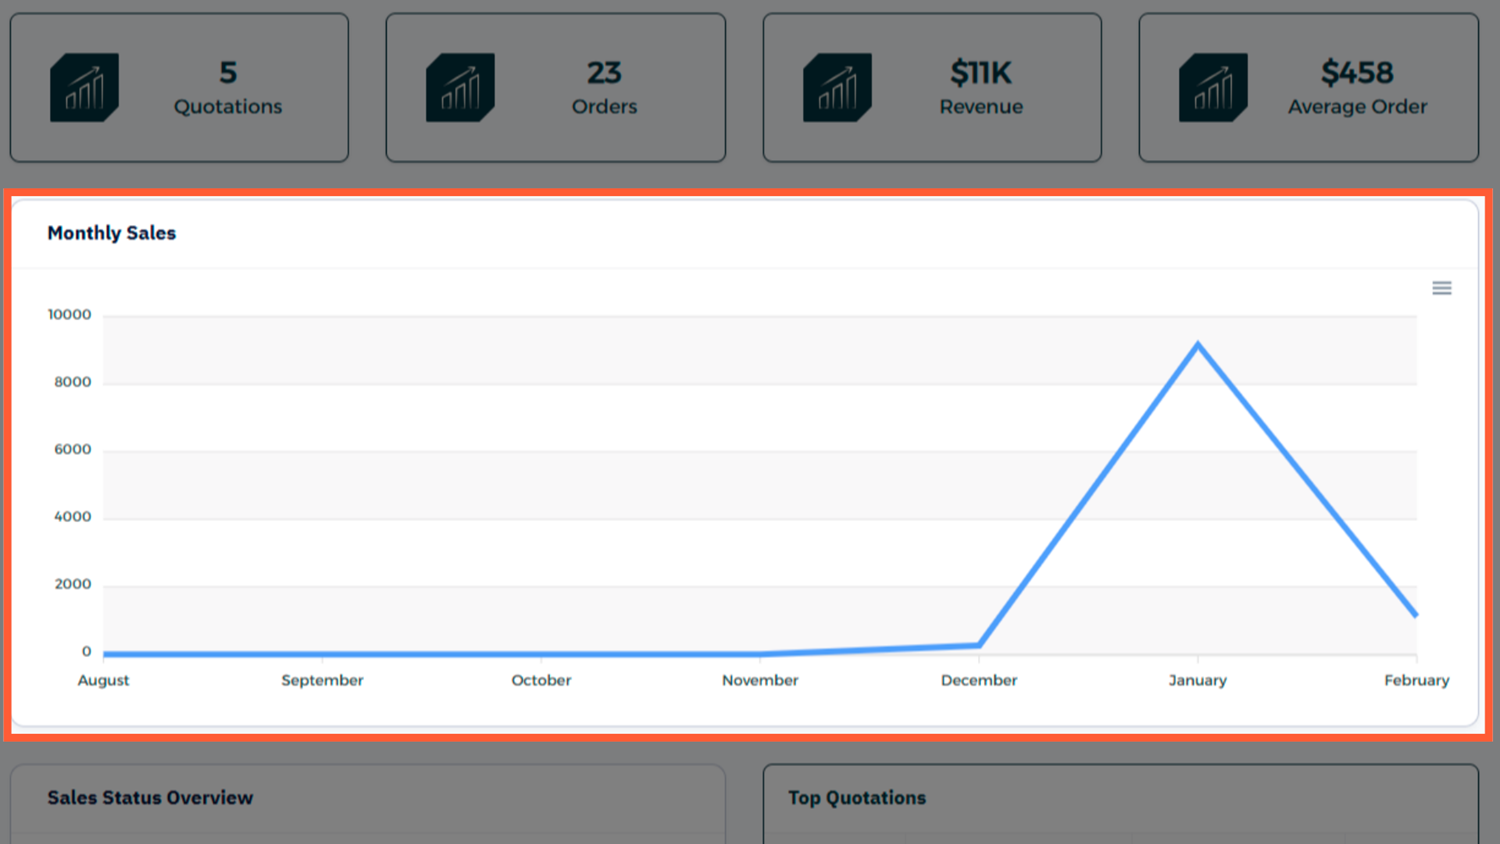
-
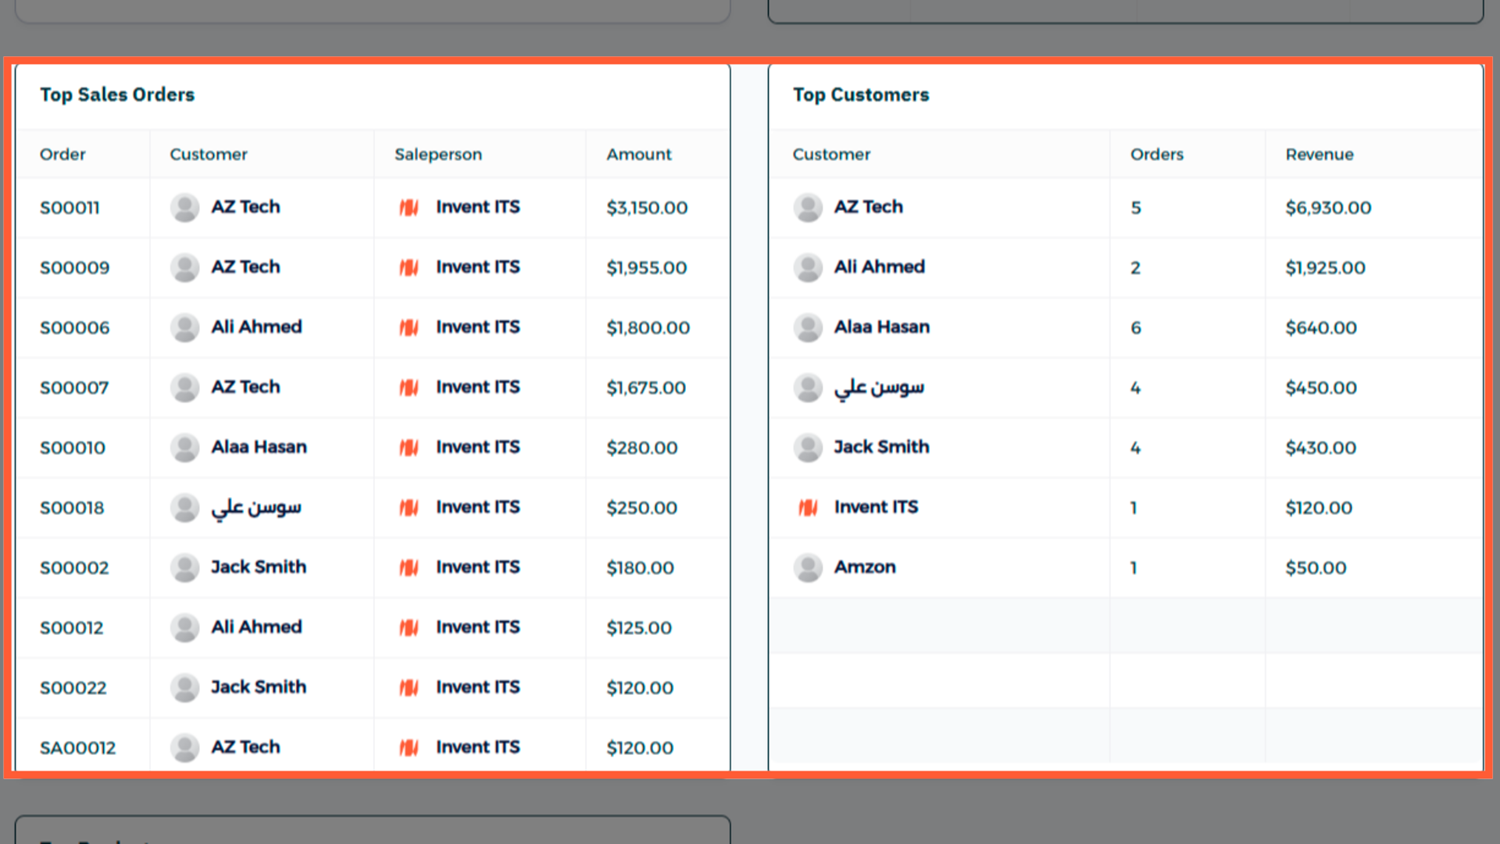
Spot Top Products and Customers
Check which products or clients contributed most to revenue. Use this to guide future sales strategy or promotions.


Smooth Workflow: From Quotation to Invoice
One of the most powerful features of Invent ERP is how all modules are interconnected. From the Sales Dashboard, users can seamlessly transition into operational processes:
- Start by creating a Quotation
- Once confirmed, convert it into a Sales Order
- Generate an Invoice directly from the order
- Register the Payment once it’s received
This end-to-end workflow ensures nothing is lost in handoff, and your team has complete visibility — from the first quote to final payment — all within the same system. No manual duplication, no switching between disconnected tools.
Best Practices
- Regular Review: Check this dashboard daily or weekly to stay informed
- Set Goals: Use filters to track progress toward monthly or quarterly targets
- Share Insights: Export charts or data for team meetings or performance reports
- Watch Trends: Identify slow-moving products or underperforming reps quickly
Frequently Asked Questions
Q: Can I customize the dashboard layout?
A: Yes — with admin permissions, you can rearrange columns, add filters, and adjust date ranges.
Q: Does it update in real time?
A: The dashboard typically refreshes every few minutes, but you can manually refresh for the latest data.
Q: Can I export data from the dashboard?
A: You can export chart data or KPI tables to CSV or PDF for external reporting or analysis.
Final Thoughts
The Sales Dashboard in Invent ERP offers a high-level, interactive view of your sales health. But it goes beyond just charts — it connects seamlessly with your full sales cycle, from quotation to invoice to payment, helping your team stay efficient and informed at every stage.